
Corn
producers who want to fine-tune nitrogen (N) application rates must first
determine how much N is being supplied by the soil. This may change significantly
with each growing season depending on a host of factors including crop
rotations, tillage and weather. This article provides an example of how
spring soil nitrate concentrations can vary from year to year in a situation
where crop management factors are held constant.
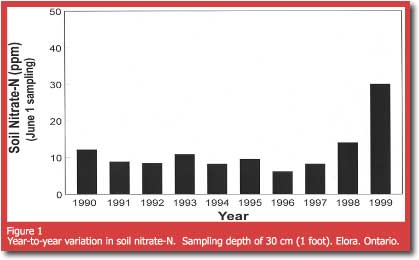
A research project started in 1990 to measure soil nitrate-N concentrations
in the surface foot of soil. Measurements were taken on or near June 1,
on a long-term experiment located at the Elora Research Station, University
of Guelph. Figure 1 shows the yearly variations in soil nitrate-N concentrations
from 1990 to 1999 where corn has been planted continuously. Fertilizer
N was always applied side-dress, at a rate of 140 lb N/ac, so the observed
nitrate concentrations represent the N availability prior to fertilizer
N application.
From 1990 to 1997, nitrate-N concentrations typically ranged from eight
to 12 ppm concentrations which according to the soil N test, would indicate
fertilizer N requirements ranged from 100 to 140 lb N/ac. However, soil
nitrate-N concentrations dramatically increased during 1998 and 1999 years
with April and May temperatures which were substantially (2 to 6oF) above
normal and rainfall amounts which were half to two-thirds of normal. The
unusually warm springs of 1998 and 1999 probably increased rates of N
release from organic matter. When coupled with below normal rainfall (which
minimized the potential for leaching) nitrate concentrations ended up
greater than those observed during any of the earlier eight years.
 Starting
in 1996, we also measured the quantity of nitrate-N in the fall (early
November). We thought perhaps excessive fertilizer N application would
result in unusually high quantities of nitrate in the fall. During 1996
and 1997, fall nitrate-N amounts were generally low (25 lb N/ac) and probably
reflect the amount of nitrate which can be expected to accumulate from
natural sources. However, the quantity of residual nitrate measured in
the fall of 1998 was 90 lb N/ac, suggesting that fertilizer N requirements
were not as great during 1998. It's interesting that the nitrate-N concentration
during the spring of 1998 suggested that only 80 lb/ac of N fertilizer
was required, which is 60 lb/ac less than applied. This over-application
seems to be reflected in the quantity of N left over at the end of the
season.
Starting
in 1996, we also measured the quantity of nitrate-N in the fall (early
November). We thought perhaps excessive fertilizer N application would
result in unusually high quantities of nitrate in the fall. During 1996
and 1997, fall nitrate-N amounts were generally low (25 lb N/ac) and probably
reflect the amount of nitrate which can be expected to accumulate from
natural sources. However, the quantity of residual nitrate measured in
the fall of 1998 was 90 lb N/ac, suggesting that fertilizer N requirements
were not as great during 1998. It's interesting that the nitrate-N concentration
during the spring of 1998 suggested that only 80 lb/ac of N fertilizer
was required, which is 60 lb/ac less than applied. This over-application
seems to be reflected in the quantity of N left over at the end of the
season.
Clearly, the quantity of soil-supplied available N (and, as a consequence,
corn fertilizer N requirement) can vary greatly from year to year. Higher
spring nitrate concentrations, warmer spring temperatures, and (or) below
normal rainfall seem to be related, but the soil N-test is the only way
to confirm the actual quantity of naturally available N.
We acknowledge there is some controversy about the ability of the soil
N-test to pinpoint corn fertilizer N requirements on the field scale.
But there is considerable research which suggests the soil N-test fits
into an overall nitrogen management strategy and will help identify fields
and years where fertilizer N is definitely not required...or can be applied
at substantially reduced rates.
Acknowledgements
Research was conducted by the University of Guelph under the direction
of Dr. Tony Vyn through funding provided by the Ontario Ministry of Agriculture,
Food and Rural Affairs.